Arguments for a UBI – The Accountant
This post is part of the sequence Arguments for a Universal Basic Income.
Simple Tax Code
In countries that try to have a progressive tax system, income taxes can be exceedingly complicated. The tendency is to try not to tax people very much when they are earning less than a certain amount, then to increase the percentage that their income is taxed at, as that income increases. This is seen as preferable to taxing everyone at the same rate, as although 20% of a £10,000 income is much less than 20% of a £100,000 income, that £2,000 is essential for the first person to be able to eat, whereas the person earning £100,000 could spare a lot more than £20,000 before even noticing the difference.
To take the UK as an example, in the 2018-19 tax year, the first £11,850 of your annual income is not taxed, then anything received above that is taxed at 20%. Anything above £46,350 had an additional 20% tax applied (called the 40% or higher rate band), and anything above £150,000 had a further 5% applied (called the 45% or additional rate band). This is further complicated by the fact that for every £2 of income over £100,000 that you earned, you lose £1 of the tax free £11,850, which is then taxed at 40%, resulting effectively in any income between £100,000 and £123,700 being taxed at an additional 20% (a notional 60% band).
Finally, to make matters even more confusing, there is Employee’s National Insurance – an income tax in all but name, which is an additional 12% on any income between £8,400 and £46,350, and an additional 2% on anything above that. Expressed in a table, this looks as follows:
| Lower Income Threshold | Upper Income Threshold | Income Tax Rate | NI Rate | Combined Tax Rate Applied Within Band |
|---|---|---|---|---|
| £0 | £8,400 | 0% | 0% | 0% |
| £8,400 | £11,850 | 0% | 12% | 12% |
| £11,850 | £46,350 | 20% | 12% | 32% |
| £46,350 | £100,000 | 40% | 2% | 42% |
| £100,000 | £123,700 | 60% | 2% | 62% |
| £123,700 | £150,000 | 40% | 2% | 42% |
| £150,000 | + | 45% | 2% | 47% |
There are a great many resources such as online tax calculators that help to make sense of all of this, but what I am interested in here is the “effective tax rate”, that is, if you were to apply the same rate to all of your income to come up with your tax bill, what would that rate be.
The results of the UK income tax code are shown as a blue line on the graph below (plotted on a logarithmic x-axis – doubling with each successive gridline rather than increasing a fixed amount, so that it is easier to see the detail):
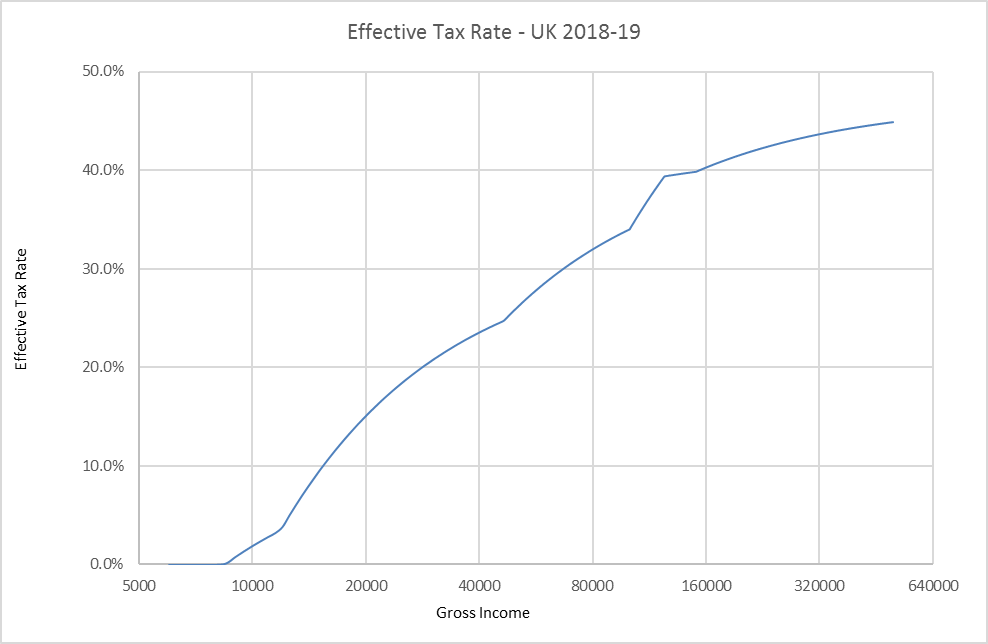
The gross income is the amount paid before tax, and the impact of the thresholds mentioned above, mean that someone earning £20,000 per year will pay £3,022 in tax, for an effective tax rate of 15.1%, while someone earning £80,000 will pay £25,587 in tax, for an effective tax rate of 32.0%. The strange kinks in the line are a direct result of the discontinuities in the tax bands, but the intention is clear – to tax higher earners at a higher rate than lower earners, this being the definition of a progressive tax.
Whilst much simpler, clearly taxing everyone at the top rate of 47% (45% plus 2% National Insurance) on all their income is not ideal, as this would be an enormous financial burden on people with lower incomes, and would be a huge tax increase for everyone except people earning well into the seven figures. What happens when we combine it with a Universal Basic Income however?
The red line on the graph below shows the effective tax rates under a hypothetical tax code which taxes all earned income at 47%, but also pays a Universal Basic Income of £8,000 per annum. As you can see, rather than a flat line across the top at 47%, which would be the result without a Universal Basic Income, the combined effect of a flat tax rate and a Universal Basic Income gives rise to a similar shaped curve to the one produced by the exceedingly complicated UK tax code:
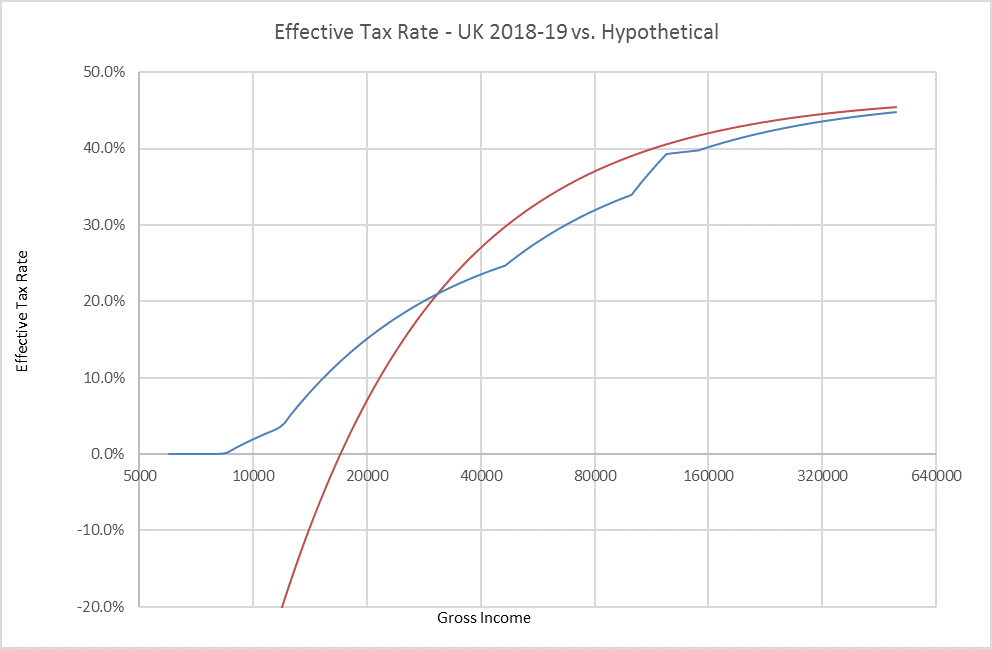
There are a few key things to note here:
- The effective tax rate for someone earning £17,000 per annum is 0% – they are paying tax at 47%, which is £7,990, but they are receiving a Universal Basic Income of £8,000, so the net effect is that they pay no tax.
- Anyone earning less than this has a negative effective income tax rate – someone earning £10,000 per annum will be paying £4,700 in tax, but receiving £8,000 in Universal Basic Income, for a net income of £13,300, or a tax rate of -33%.
- At about £31,000 per annum the two tax codes result in about the same amount of tax. Under the UK system, you get the first £8,400 untaxed, between £8,400 and £11,850 is taxed at 12% for £414, between £11,850 and £31,000 is taxed at 32% (20% plus 12%) for £6,128, giving a total of £6,542 or an effective tax rate of 21.1%. Under the hypothetical system, all £30,000 is taxed at 47%, for £14,570, and then Universal Basic Income of £8,000 is received, giving a net tax bill of £6,570, or 21.2%.
- Above this point, the hypothetical tax code does result in a higher tax rate. Someone earning £40,000 per annum would see their effective tax rate increase from 23.6% to 27.0% – an increase in tax of £1,378, or £115 per month, while someone earning £80,000 per annum would see an increase from 32.0% to 37.0% – an increase in tax of £4,013, or £334 per month.
- The lines are both approaching 47% as incomes increase. Neither line will ever reach exactly 47%, but the impact of the lower tax brackets or the Universal Basic Income become less and less significant as the gross income increases.
With just two numbers, 47% and £8,000, it was possible to define a tax code that is progressive, understandable and fairly similar to the existing UK code. Furthermore, it is difficult to argue that this code is unfair, as it is not punitively targeting high earners with very high tax rates – both numbers apply to everyone, at every income level.
This rather neatly demonstrates the counterargument to the oft raised objection that “Only people who need it should get state assistance”, and “paying money to the rich is a waste”. When viewed together with the tax code, it becomes clear that a Universal Basic Income is effectively a reduction in tax for anyone with a positive effective tax rate. If it is deemed that the rich are not paying enough tax after factoring in the Universal Basic Income, then the tax rate can be increased, but in this scenario, anyone earning over £31,000 has already seen a net tax increase, so these people are definitively not “being paid extra money”. The impact of a Universal Basic Income on anyone with a positive effective tax rate (here, people earning over £17,000) is simply to change their effective tax rate. Certainly, they will be receiving payments from the government, but they will also be paying taxes, so it will be the change in the total amount of money they take home at the end of every month that they care about.
The benefit for the government in operating this way is simplicity – by paying everyone in the country, and taxing everyone in the country, there is no need for entire government departments devoted to means testing, nor is there a need to perform a calculation any more complicated than multiplying two numbers together, to work out how much tax to charge. It might seem inefficient for the government to be paying someone money only to recoup it back as tax, but transferring money is an incredibly simple and quick thing to do. Checking that a calculation is correct, and verifying that exactly the right amount has been received or paid is the thing that takes time and effort, which makes it a good idea to reduce the amount of complexity in the calculations as much as possible, even if it does mean doubling the number of transactions.
5 Replies to “Arguments for a UBI – The Accountant”
Have you considered secondary feedback effects? For example,
1) The new tax scheme would roughly double the incentives for tax evasion for middle class earners.
2) A large fraction of people might quit working altogether.
3) Emigration of net payers and immigration of net receivers would go up.
Is there a strong reason to think that these would be negligible?
Good questions – all three points are feedback effects that would likely have some impact in the direction you suggest. I will explain my reasoning for thinking these would be small.
(1)
Currently tax evasion accounts for a £5.3bn per annum[1] gap – this encompasses income tax evasion, but also includes VAT evasion, capital gains evasion, etc. Even if we assume that all of this is income tax evasion, and assume that the change in incentive doubles the amount of evasion, an additional £5.3bn makes up about 0.8% of income tax receipts. Using these fairly extreme assumptions, we end up with a <1% impact, so in the hopefully more likely scenario that only ~50% of the 5.3bn is income tax, and UBI increases evasion by only ~50%, we end up with a 0.2% impact which is (I would consider) fairly negligible. Then you have the fact that (at least in the UK) most middle class people pay their taxes through PAYE, which is administered by the company they work for, so there is less opportunity for them to benefit from "under the table" payments.
(2)
Someone has done some good analysis[2] of some UBI-esque schemes in North America, and has concluded that of the people included in the experiment, an average of around 10% left the workforce. The person doing the analysis views this as an unacceptably large number, but these schemes were only targetted at low-income groups, so there is a large selection effect. People on higher incomes are less likely to accept a large reduction in the their standard of living. Even if we make a generous assumption that 30% of the working population are sufficiently low-income that this 10% statistic applies to them, we have a reduction in the workforce of 3%.
As a very, very rough calculation of the economic impact of this (using the US, as the studies were in North America), there are 155m jobs in the US, so losing 3% of the workforce translates to 4.65m jobs. As these are low-income jobs, let's say they pay on average $20,000 p.a. - that results in a productivity reduction of $93bn. The US GDP is $20.5tn, so that would correspond to a 0.45% reduction to GDP - as a one off hit, I would consider this negligible. In the UK, I would expect this to be even smaller, as our existing benefits system is more comprehensive and generous to start with, so we are starting from a different position.
(3)
The first thing that makes me fairly confident that this would be a small effect is the fact that immigrants on average contribute significantly more in taxes than they consume in government services. It takes effort and motivation to uproot your life, and often a job offer is required in order to get a visa anyway. In order to receive a UBI, the government has to know that you exist, so undocumented immigration wouldn't be encouraged. Factors such as job availability, general state of the economy, language and existing immigrant community play significant parts in where and whether people immigrate, but it cannot be denied that generosity of state support may be a factor in some potential immigrants' decision making.
It is a complicated issue with many facets, but thankfully someone at LSE has already done some regression on the effect of welfare on immigration[3]. This analysis uses a "de-commodification factor", that "refers to the degree to which individuals, or families, can uphold a socially acceptable standard of living independently of market participation". In the Western countries it analyses, this factor varies from 18.3 in the US to 35.9 in Norway. Their regression analyses asylum seekers separately from economic migrants, and shows that a 1 unit increase in this factor increases asylum seekers by 11.9% (with R squared of 0.63), but actually decreases economic migrants by 2.06% (with R squared of 0.52). Given that only about 35,000 of the 627,000 immigrants to the UK in 2018 were asylum seekers, I think this suggests a fairly small impact.
On the emigration of net payers, I would simply say that the proposal above doesn't actually affect high earners much at all - the effective tax rate of anyone earning £120,000 or more has gone up by 1.8% or less. The most that anyone's effective tax rate goes up is 5% (for people earning between £46k and £100k). Some people would probably be spurred to seek their fortunes elsewhere by this, but 5% is well within the bounds of a normal governmental policy shift, especially if spread over several years. There don't appear to be any particularly good studies on this, but the most mobile people are the ones that are the most rich, which is why this proposal doesn't include a higher rate bracket targeting them.
[1] https://www.patrickcannon.net/insights/uk-tax-evasion-statistics/
[2] https://www.chrisstucchio.com/blog/2019/basic_income_reduces_employment.html
[3] http://www.lse.ac.uk/government/Assets/Documents/pdf/research-groups/msu/WP-2012-02.pdf
1) “assume that the change in incentive doubles the amount of evasion”
I’m not sure this is an extreme assumption. In the US the income tax rates have changed drastically over the last 60 years (from >90% to <40% marginal rate) while the amount of taxes government manages to collect remained roughly constant (~30% of GDP). People do not necessarily do things that are strictly illegal, but they spend a lot of money and effort in searching for loopholes.
3) “immigrants on average contribute significantly more in taxes than they consume in government services”
I can easily believe that statement for countries like Canada or Australia which have highly selective immigration system, but I doubt it’s true for the US or Europe. The study about immigrants in Germany found that all major immigrant communities are net consumers of government resources and most communities remain net consumers even in the second generation. Why would this be different in the US or UK?
People do like to find tax loopholes it is true. The top marginal rate in the US is quite an outlier though – the very wealthiest of people are the ones with the most resources to avoid tax, so I don’t think the 90% top rate ever really netted the government much – that’s got to be a long way past the peak of the laffer curve. An ordinary middle-class worker can’t quite as easily run their income through a loan to a Panamanian company. It’s a tricky one to give any sort of conclusive answer to either way.
According to https://migrationobservatory.ox.ac.uk/resources/briefings/the-fiscal-impact-of-immigration-in-the-uk/ the net impact on the UK’s public finances of migrants from the EU was positive, and from non-EU sources was negative. This is quite convenient really, as it is the non-EU immigration that we can exercise greater control over. If a UBI were found to have too significant an impact on the levels of non-EU immigration, we could always up the selectiveness of our immigration system.
I think for all three of these points, the best that we can really accomplish with the amount and quality of data at hand is fairly rough estimation. The real key is not implementing any huge sweeping changes too rapidly – for all that I am in favour of UBI, if the government announced that they were planning on introducing a full £8,000 UBI next month, I would be pretty wary. Any large systematic change is a big risk, so it is better to break it down into manageable and reversible changes if possible, so that issues can be spotted and remedied, or changes can be rolled back entirely if unexpected negative outcomes start occurring.
This is actually what the Conclusion post is going to be about (planned for 27/5) – how to break down the shift to UBI into small manageable steps that are workable from a public choice perspective, and don’t leave the government in a position that it can’t roll them back if unexpected consequences arise.