Arguments for a UBI – Appendix
This post is part of the sequence Arguments for a Universal Basic Income.
The United States
Having seen the complexities of the existing UK tax code and devised a much simpler way of doing a very similar thing, it is tempting to try to do the same with the US, however there are a couple of additional complexities to note before we can get started in earnest.
Firstly, the states can levy their own income taxes in addition to the federal income tax. We will ignore state taxes, and look simply at the federal tax code. Secondly, there are a huge number of special cases, loopholes and adjustments that apply when calculating US income tax, meaning that the effective rate people end up paying is often lower than the one that can be easily calculated using the headline rates. This is unavoidable without considerable analysis, but the easily calculated rates should suffice at least for an initial comparison with the hypothetical Universal Basic Income based regime.
Secondly, changing taxes in the US is even more of a political minefield than it is in the UK. Many people have put forward Universal Basic Income proposals for the US in recent years, and most of these have been very loose with costings, utilising rather wishful thinking about the economic windfalls of the proposal in order to fund it without releasing the bogeyman of tax increases. Compared with the UK, it may take significantly more time and political will to achieve the scheme detailed below, because of the resistance to any perceived tax hike. Rather than focusing on a route to implementation however, this is simply a demonstration of a possible approach, which does not shy away from attempting a proper costing. Whilst the argument can be made that tax increases generally net less revenue than one might naively forecast, due to lost growth and more effective avoidance strategies; this should not be too much of an issue here, because in a similar way to the proposal for the UK, the tax increases necessary in the approach below are significantly less severe than what might be expected – in the order of a few percent rather than tens of percent.
Taking the US tax code as it looked in 2016, the majority of people will have had a “Standard Deduction” of $6,350, and a “Personal Exemption” of $4050, giving a total tax-free income of $10,400. After this, there are several bands rising from 10% to 39.6%. In addition to this, in a similar way to National Insurance in the UK, there is a separate tax applied to income specifically to pay for the Social Security and Medicaid programs. This is set at 6.2% on all incomes below $118,500 for Social Security, 1.45% on all incomes without limit for Medicaid, and an additional 0.9% on all incomes above $200,000 for Medicaid. This is all best expressed in tabular form (assuming Standard Deduction and Personal Exemption apply):
| Lower Income Threshold | Upper Income Threshold | Lower Threshold Exc. SD & PE | Income Tax Rate | Social Security Tax Rate | Tax Rate Applied Within Band |
|---|---|---|---|---|---|
| $0 | $10,400 | – | 0% | 7.65% | 7.65% |
| $10,400 | $19,725 | $0 | 10% | 7.65% | 17.65% |
| $19,725 | $48,350 | $9,325 | 15% | 7.65% | 22.65% |
| $48,350 | $102,300 | $37,950 | 25% | 7.65% | 32.65% |
| $102,300 | $118,500 | $91,900 | 28% | 7.65% | 35.65% |
| $118,500 | $200,000 | 28% | 1.45% | 29.45% | |
| $200,000 | $202,050 | 28% | 2.35% | 30.35% | |
| $202,050 | $427,100 | $191,650 | 33% | 2.35% | 35.35% |
| $427,100 | $428,800 | $416,700 | 35% | 2.35% | 37.35% |
| $428,800 | + | $418,400 | 39.6% | 2.35% | 41.95% |
The effective tax rate calculated from these bands is plotted on the graph in blue, against a curve in red showing the effective tax rate given by a Universal Basic Income of $10,000 per annum, and a flat tax of 37% on all earned income:
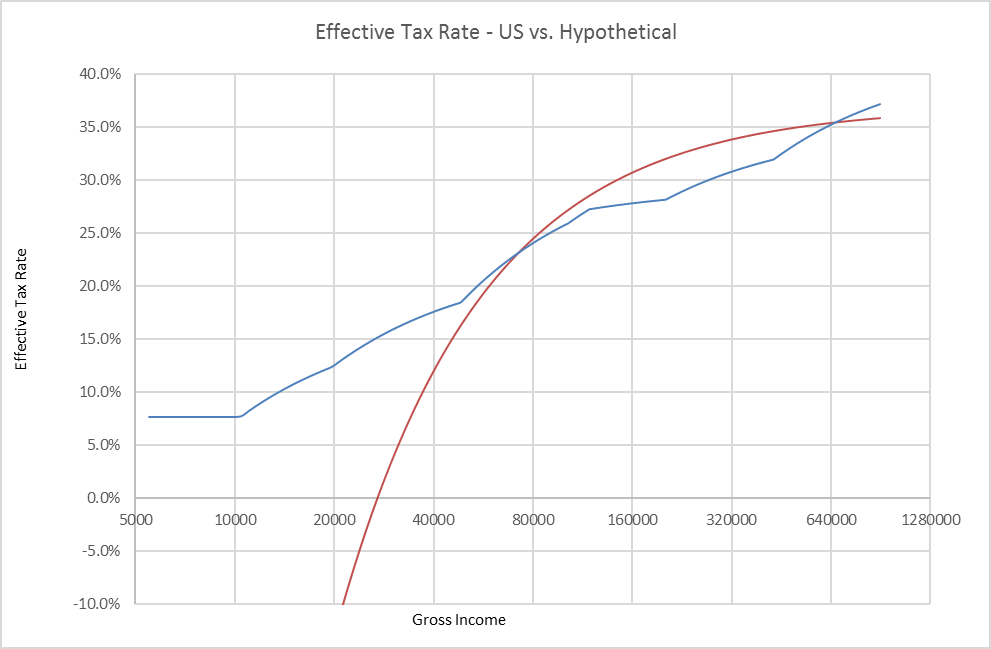
These two lines are less similar than they were in the UK case, as US tax starts higher for people with lower incomes but rises more slowly as incomes increase. In fact, the graph will only show the blue line approaching the top rate of 41.95% at incomes of several million dollars. This makes the red line a significant tax decrease for a very large number of low income households – people would pay no net income tax at all until they were earning over $27,000 (37% of $27,000 is $9,990, which would net off against the Universal Basic Income). This is actually a similar level of income at which tax starts to kick in, to the UK example. Over the past 5 years, the GBP/USD exchange rate has fluctuated from around 1.2 to 1.7 (dollars to the pound), so taking near to the middle of this range, $27,000 divided by 1.5 gives us £18,000.
Due to the flat tax being at 37% in the hypothetical case, the red line dips back below the blue line for very high earners, suggesting that they would see a reduction in their effective tax rate under such a policy. We can however calculate the actual effective tax rate (ETR) paid by such high earners, using statistics gathered by the Tax Foundation.
Although the Tax Foundation figures exclude the Social Security tax, we can estimate this in the same manner as was done for NI in the UK, allowing us to produce a similar table, showing that the total US income and Social Security tax receipts for 2014 (2016 figures have yet to be published at time of writing) were $1,955 billion, on a total income of $9,709 billion:
| Cohort | Range of total income (lower limit) | All taxpayers | Total income of taxpayers | Income Tax liability | Social Security Tax | Total Tax | Avg. ETR |
|---|---|---|---|---|---|---|---|
| $ | ‘000s | $billion | $billion | $billion | $billion | ||
| Lower 50% | 0 | 69,781 | 1,094 | 38 | 84 | 122 | 11% |
| 25-50% | 38,173 | 34,890 | 1,925 | 144 | 147 | 291 | 15% |
| 10-25% | 77,714 | 20,935 | 2,107 | 219 | 161 | 380 | 18% |
| 5-10% | 133,445 | 6,978 | 1,092 | 150 | 67 | 217 | 20% |
| 1-5% | 188,996 | 5,582 | 1,493 | 281 | 66 | 347 | 23% |
| 0.1-1% | 465,626 | 1,256 | 1,012 | 270 | 31 | 301 | 30% |
| Top 0.1% | 2,136,762 | 140 | 986 | 273 | 24 | 297 | 30% |
| Total | 139,562 | 9,709 | 1,375 | 580 | 1,955 |
The effective tax rate paid by the highest earners in reality looks to be around 30% on average; much lower than 37%. This suggests that the hypothetical case might not be a tax cut for high earners after all, unless a significant number of the loopholes and adjustments that currently exist were kept in place.
Next, we need details of the US welfare programs that would be replaced by the Universal Basic Income, to find the net contribution of the current system. Again, we are not intending the Universal Basic Income to replace medical programs, so this excludes Medicare, Medicaid and the Child’s Health Insurance Program. As US welfare programs are spread across a wide range of different government departments, to find this information, we need to look on several other sites.
Here we find that the main welfare programs cost the US federal government the following amounts (mostly 2014, or as near to it as I found data):
| Welfare Program | $billion |
|---|---|
| Old Age and Survivors Insurance (OASI) | 714.2 |
| Supplemental Nutrition Assistance Program (Food Stamps or SNAP) | 74.1 |
| Earned Income Tax Credit (EITC) | 67.7 |
| Child Tax Credit (CTC) | 57.0 |
| Housing Choice Voucher Program (HCV) | 18.0 |
| Temporary Assistance for Needy Families (TANF) | 16.6 |
| Project-Based Rental Assistance (PBRA) | 12.0 |
| Low-Income Home Energy Assistance Program (LIHEAP) | 3.4 |
| Total | 963.0 |
Based on this total cost of $963 billion, we can calculate that the net income tax revenue after welfare programs in 2014 was approximately $992 billion.
The Universal Basic Income concept plotted on the graph above, of $10,000 per person over-16 per annum and a flat tax of 37%, can be tabulated using the same cohorts, adding in a cohort of non-taxpayers to make the full over-16 population of the US up to 251,931,000 (2014 population of 318.9m multiplied by 79% over-16):
| Cohort | Range of total income (lower limit) | All Taxpayers | Total income of taxpayers | Tax liability | Universal Basic Income | Net Tax Contribution |
|---|---|---|---|---|---|---|
| $ | ‘000s | $billion | $billion | $billion | $billion | |
| Non-Taxpayers | 112,369 | 0 | 0 | 1124 | -1124 | |
| Lower 50% | 0 | 69,781 | 1,094 | 405 | 698 | -293 |
| 25-50% | 38,173 | 34,890 | 1,925 | 712 | 349 | 363 |
| 10-25% | 77,714 | 20,935 | 2,107 | 780 | 209 | 570 |
| 5-10% | 133,445 | 6,978 | 1,092 | 404 | 70 | 334 |
| 1-5% | 188,996 | 5,582 | 1,493 | 552 | 56 | 497 |
| 0.1-1% | 465,626 | 1,256 | 1,012 | 374 | 13 | 362 |
| Top 0.1% | 2,136,762 | 140 | 986 | 365 | 1 | 363 |
| Total | 251,931 | 9,709 | 3,592 | 2,519 | 1,073 |
This demonstrates a net contribution to the government’s finances of $1,073 billion – very close to the current system’s contribution of $992 billion.
In a similar way to the previous section, from the US having a population of 251,931,000 over-16s, 66,969,000 under-16s and a combined countrywide personal income of $9,709 billion, we can calculate that:
| Every $500 of UBI given per person over-16 | will cost $126.0 billion |
| Every $500 of UBI given per person under-16 | will cost $33.5 billion |
| Every 1% of tax applied to personal incomes | will raise $97.1 billion |
This allows us to easily calculate different approaches that also closely match the current system’s contribution, such as $8,000 and 31%, or $12,000 and 42%. Alternatively, if families caring for children under-16 received a Universal Basic Income of $3,000 per child, this would bring the contribution down to $872 billion.
One further additional complexity with the US system, is that unlike in the UK, where the level of Universal Basic Income that was being suggested was roughly level with the existing state pension amount, US social security payments can vary hugely, depending on how much tax a person has paid over their working life, and how early or late they retire. From this document published by the Social Security Administration, we can find that the maximum benefit a retiree could receive is $2,639 per month ($31,668 per annum), but the average payment is $1,341 per month ($16,092 per annum).
This average is significantly higher than the suggested $10,000 Universal Basic Income, meaning that whilst the retirees getting less than $10,000 per annum under the current system would be better off, a significant number would be receiving less money than before.
As it can be argued that the government has an obligation to provide the pension that was promised, or at least not reduce it suddenly and drastically, it would be reasonable to ensure that the level of retirement benefits did not decrease for anyone immediately. The Universal Basic Income covers the first $10,000 for all retirees (again, making some of them better off), leaving on average around $6,092 per retiree per annum needing to be funded. This amount should be roughly 38% (6,092/16,092) of the $714.2 billion OASI expenditure, or around $270 billion per annum.
The Social Security Administration runs an endowment for the OASI scheme called the Old Age and Survivor’s Trust Fund, which currently stands at $2,801 billion (as of 2016). This could fund the $270 billion difference for a decade before it was depleted, however this assumes no investment income. If the difference between the contributions of the current system and the proposed system ($81 billion) were added to this fund each year and it continued to get a return on investment of around 3.5% per annum, this would allow the endowment to pay out $270 billion per annum for another 21 years. Reducing the payments gradually after the first few years would therefore allow payments to be made for even longer, easing the transition from the current system to the Universal Basic Income.
The solvency of the Social Security program’s trust fund is a very serious issue currently, as forecasts show it running out between 2030 and 2035, due to an ageing population increasing the OASI costs. The result of the trust fund running out would mean that after this point, pensions could only be funded by the Social Security Tax receipts, which could cause a sudden dramatic reduction in pensions. The Universal Basic Income, by guaranteeing a $10,000 per annum income, would mean that the only people affected by the solvency of the trust fund would be wealthier retirees, entitled to a higher pension, but also more likely to have supplementary private pensions too.
One Reply to “Arguments for a UBI – Appendix”
I agree we need a ubi. Mellivora, definitely reach out if you want to brainstorm about making it happen. For example, one trick of making usa ubi less costly is to lower welfare spending at the individual state level. (And frankly I can’t even believe that someone as smart as you suggested lowering garanteed retirement benefits! That is simply not the path to victory here)